“2018 may be remembered as the year in which things were not quite as they appeared for female characters,” Dr. Martha Lauzen said of her analysis of women’s representation in last year’s 100 top-grossing films. With the latest “It’s a Man’s (Celluloid) World” report, the exec director of the Center for the Study of Women in Television and Film at San Diego State University found that, while the number of female protagonists increased, the number of female speaking roles and major characters plateaued.
Thirty-one percent of 2018’s top movies featured a female protagonist, a recent historical high. That’s up seven points from 2017’s 24 percent and also bests the previous high, 2016’s 29 percent.
However, 35 percent of speaking characters were women in the highest-grossing films of 2018, a one percent increase from 2017. Women represented 36 percent of major characters — i.e. characters who appear in multiple scenes and help drive the story’s action — in 2018, a one percent dip from the previous year. Overall, 35 percent of the top films boasted at least 10 female characters in speaking roles, as compared to the 82 percent that featured 10 or more speaking male characters.
“While female protagonists rebounded last year, slightly besting the previous high achieved in 2016, the percentages of females as speaking characters and major characters remained relatively stagnant,” Lauzen stated in a press release. “Protagonists are the characters from whose perspective the story is told and so seeing more females in these roles is tremendously important. However, we are not seeing similar gains in the broader populations of major characters and in all speaking roles.”
But there is a silver lining: women protagonists appeared in a variety of genres last year. Thirty-two percent of female protagonists were featured in comedies, and 29 percent in dramas. Nineteen percent of women protagonists appeared in horror films, 10 percent in sci-fi pics, and seven percent in action films.
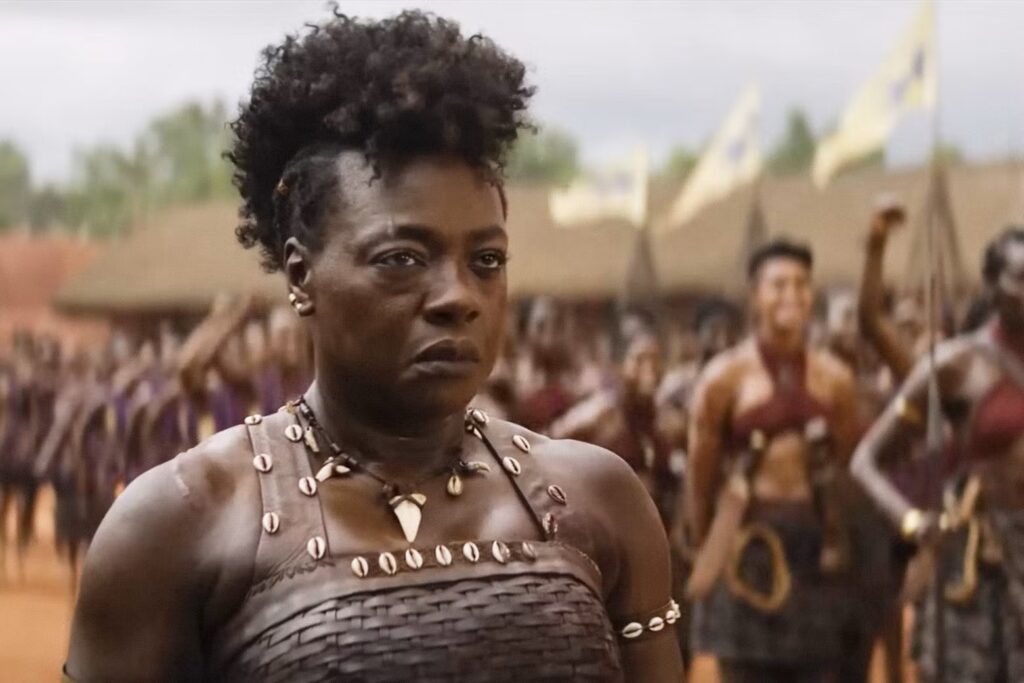
“Female protagonists were distributed throughout the top 100 films, appearing in comedies such as ‘Life of the Party’ and ‘The Spy Who Dumped Me,’ dramas including ‘A Simple Favor’ and ‘The Hate U Give,’ as well as in horror features such as ‘Halloween’ and ‘Hereditary,'” Lauzen explained. “Their appearance in a variety of genres suggests female characters are being woven more deeply into all types of stories. If a particular genre temporarily falls out of favor, it is less likely that substantial numbers of female protagonists will disappear from the big screen.”
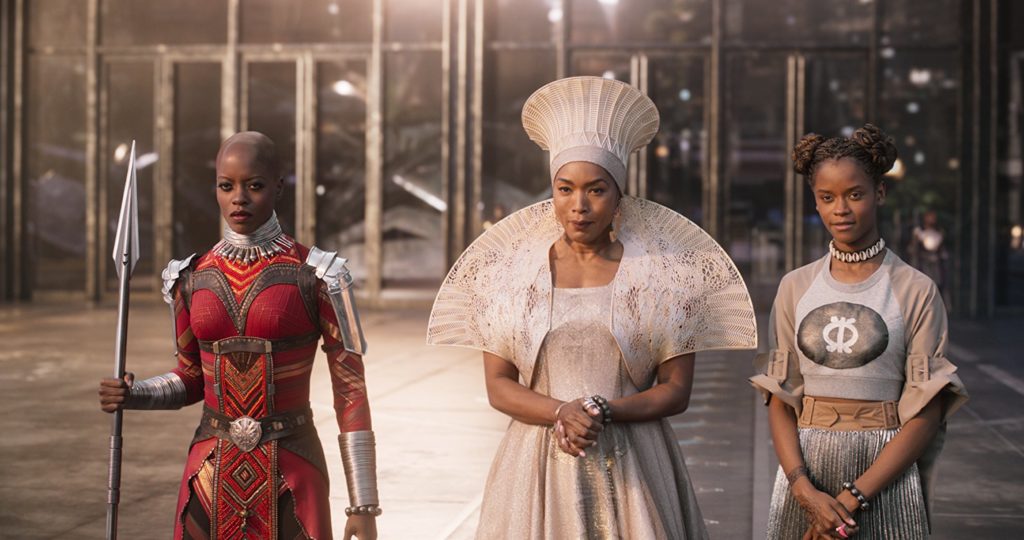
“It’s a Man’s (Celluloid) World” also examined women of color’s representation in 2018’s highest-grossing movies. Black females comprised 21 percent of women’s speaking roles, a recent historical high and a five-percent increase from 2017. Latinas fell to four percent, as compared to 2017’s seven percent. Asian women accounted for 10 percent of female speaking roles, a rise of three percent. However, this growth is mostly thanks to “Crazy Rich Asians'” success. “When this film is excluded from the analysis, Asians accounted for eight percent of females, only one percentage point above the seven percent achieved in 2017,” Lauzen specified.
The main findings from “It’s a Man’s (Celluloid) World” are below. Read the full report here.
Percentages of Female and Male Characters
- More films featured female characters as clearly identifiable sole protagonists in 2018 (31%) than in 2017 (24%) or 2016 (29%). It is a recent historical high. Males comprised 52% of protagonists, and 17% were ensembles. For the purposes of this study, protagonists are the characters from whose perspective the story is told.
- Sole female protagonists were more than twice as likely to appear in independent features (68%) as studio features (32%). Sole male protagonists were more likely to appear in studio features than in independent features (54% and 46% respectively). Ensemble protagonists were more likely to appear in studio features than in independent features (53% and 47% respectively).
- Female protagonists were most likely to appear in comedies (32%), followed by dramas (29%), horror films (19%), science fiction features (10%), action features (7%), and films in other genres (3%). Male protagonists were most likely to appear in dramas (31%), followed by action features (21%), science fiction features (15%), comedies (14%), animated features (14%), horror features (4%), and films in other genres (1%).
- Females accounted for 36% of major characters (see Figure 3). This represents a decline of 1 percentage point from 37% in 2017. Males comprised 64% of major characters. For the purposes of this study, major characters appear in more than one scene and are instrumental to the action of the story.
- Females comprised 35% of all speaking characters in 2018 (see Figure 4). This represents an increase of 1 percentage point from 34% in 2017. Males accounted for 65% of speaking characters. Overall, audiences were almost twice as likely to see male characters as female characters.
- 13% of films featured 0 to 4 female characters in speaking roles, 52% had 5 to 9 females, and 35% had 10 or more females. In contrast, 6% of films featured 0 to 4 male characters in speaking roles, 12% had 5 to 9 males, and 82% had 10 or more males.
Demographic Characteristics
- Female characters remained younger than their male counterparts (see Figure 5). The majority of female characters were in their 20s (29%) and 30s (28%). The majority of male characters were in their 30s (35%) and 40s (25%).
- Males 40 and over accounted for 45% of all male characters. Females 40 and over comprised 31% of all female characters.
- 13% of females were under 20, 29% were in their 20s, 28% were in their 30s, 16% were in their 40s, 8% were in their 50s, and 7% were in their 60s or older.
- 10% of males were under 20, 11% were in their 20s, 35% were in their 30s, 25% were in their 40s, 11% were in their 50s, and 9% were in their 60s or older.
- In 2018, 65% of all female characters with speaking roles were White, 21% were Black, 4% were Latina, 10% were Asian, and 1% were other (see Figure 6). 68% of all male characters were White, 20% were Black, 5% were Latino, 7% were Asian, and 1% were other.
- 65% of all female characters were White in 2018. This represents a decline of 3 percentage points from 68% in 2017 (see Figure 7).
- 21% of all female characters were Black in 2018. This represents an increase of 5 percentage points from 16% in 2017, and is a recent historical high.
- 4% of all female characters were Latina in 2018. This represents a decrease of 3 percentage points from 7% in 2017.
- 10% of all female characters were Asian in 2018. This represents an increase of 3 percentage points from 7% in 2017. However, it should be noted that this increase is due largely to one film, Crazy Rich Asians. When this film is excluded from the analysis, Asians accounted for 8% of all female characters, only 1 percentage point above the 7% achieved in 2017. Similarly, the percentage of male Asian characters drops from 7% with Crazy Rich Asians to 6% without. This is just 1 percentage point above the 5% achieved in 2017.
- In 2018, 70% of major female characters were white, 18% were Black, 4% were Latina, and 8% were Asian.
- Female characters were more likely than male characters to have a known marital status. 47% of female characters but 36% of male characters had a known marital status.
- A larger proportion of male than female characters had an identifiable occupation. 76% of male characters but 62% of female characters had an identifiable job or occupation.
- A larger portion of male than female characters were seen in their work setting, actually working (62% vs. 46%).
Goals and Leadership
- Male characters were more likely than females to have work-related goals (70% vs. 30%). Female characters were more likely than males to have goals related to their personal lives (54% vs. 46%).
- Male characters were more likely than females to be seen in primarily work-related roles (64% vs. 44%). Female characters were more likely than males to be seen in primarily personal life-related roles (48% vs. 30%).
- Overall, 7% of characters were leaders. For the purposes of this study, leaders are those individuals occupying a leadership position in an organization, government or group and whose instructions and/or behaviors are followed by two or more other characters.
- Females comprised 26% of leaders, while males accounted for 74% of leaders.
- Broken down by type of leader, females were most likely to be social leaders (44% vs. males 56%), followed by religious/spiritual leaders (33% vs. males 67%), white collar leaders (31% vs. males 69%), political leaders (24% vs. males 76%), professional leaders (22% vs. males 78%), blue collar leaders (18% vs. males 82%), and criminal leaders (17% vs. males 83%) (see Figure 8).
Behind-the-Scenes Employment and On-Screen Representation
- In films with at least one woman director and/or writer, females comprised 57% of protagonists. In films with exclusively male directors and/or writers, females accounted for 21% of protagonists (see Figure 9).
- In films with at least one woman director and/or writer, females comprised 47% of major characters. In films with exclusively male directors and/or writers, females accounted for 32% of major characters.
- In films with at least one woman director and/or writer, females comprised 43% of all speaking characters. In films with exclusively male directors and/or writers, females accounted for 32% of all speaking characters.