Turns out 2019 wasn’t just a historic year for women behind the scenes. Women also fared very well on-screen last year, according to the latest “It’s a Man’s (Celluloid) World” report from Dr. Martha Lauzen and the Center for the Study of Women in Television. Forty percent of the top 100 films of 2019 featured a female protagonist, a sharp increase from the previous year’s 31 percent, which was itself a recent historical high.
The 2019 “It’s a Man’s (Celluloid) World” study outlines the findings from a content analysis of more than 2,300 characters appearing in the top 100 domestic films of the year. Protagonists are defined as “characters from whose perspective the story is told.”
Women protagonists didn’t outnumber men last year, but they came pretty damn close to parity: 43 percent of the top films were led by men, compared to the 40 percent led by women. Seventeen percent of films featured ensemble casts.
As for major characters and speaking characters, the number of females remained about the same as the previous year. Females represented 37 percent of major characters, or characters who “appear in more than one scene and are instrumental to the action of the story.” This marks a one percent increase from 2018. Females accounted for 34 percent of all speaking characters in the top films of 2019, a one percent dip from 2018.
The growing number of female protagonists is exciting, yet, as Lauzen stated, male characters are still much more visible in top films than females. “We have now seen two consecutive years of substantial gains for female protagonists, indicating the beginning of a positive shift in representation,” she commented. “That said, it is important to note that moviegoers are still almost twice as likely to see a male character as a female character in a speaking role.”
In terms of where audiences are most apt to see women protagonists, “It’s a Man’s (Celluloid) World” concluded that women and girls mostly led horror pics (26 percent), dramas (24 percent), and comedies (21 percent). Forty-five percent of female protagonists appeared in studio features, and 55 percent in indies. In 2018, this figure was 32 percent studio and 68 percent indie.
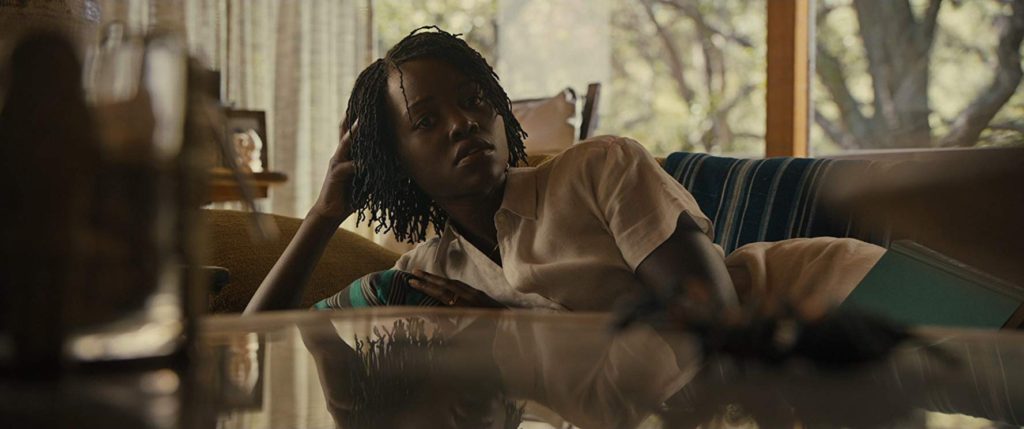
“We saw female protagonists across genres, including in horror films such as ‘Us’ and ‘The Curse of La Llorona,’ dramas including ‘Little Women’ and ‘Harriet,’ and action features like ‘Captain Marvel,” Lauzen said. “We’re seeing a wider variety of stories being told from a female perspective.”
Unfortunately, we’re not seeing many more stories from women of color’s perspectives. The number of black female speaking roles slightly decreased from 2018’s 21 percent to 20 percent last year. The number of speaking Latina characters made a minor increase to five percent, as compared to the previous year’s four percent. Speaking Asian female characters fell to seven percent from 2018’s 10 percent.
And while the number of female protagonists is growing, the gender stereotypes that have plagued women characters since, well, forever, persist. Female characters are more likely to have a known marital status than their male counterparts (46 percent vs. 34 percent). Male characters, meanwhile, are more apt to have an identifiable occupation (73 percent vs. 61 percent) and to be seen on the job working (59 percent vs. 43 percent).
Highlights from “It’s a Man’s (Celluloid) World: Portrayals of Female Characters in the Top Grossing Films of 2019” are below. Read the full report here.
Female and Male Characters
- In 2019, the percentage of top grossing films featuring female protagonists rose 9 percentage points from 31% to 40%. 43% of films featured male protagonists, and 17% had ensembles or a combination of male and female protagonists.
- Sole female protagonists were almost as likely to appear in studio features as in independent features in 2019. 45% of female protagonists appeared in studio features and 55% appeared in independent features.
- In comparison, sole male protagonists were more likely to appear in studio features (57%) than in independent features (43%) in 2019.
- Female protagonists were most likely to appear in horror features (26%), followed by dramas (24%), comedies (21%), action features (16%), science fiction features (8%), and animated features (5%). Male protagonists were most likely to appear in action features (26%), followed by dramas (24%), animated features (21%), comedies (14%), horror features (12%), and science fiction features (2%).
- Females accounted for 37% of major characters. Males comprised 63% of major characters.
- Females comprised 34% of all speaking characters. Males accounted for 66% of speaking characters. Overall, audiences were almost twice as likely to see male characters as female characters.
- 16% of films featured 0 to 4 female characters in speaking roles, 48% had 5 to 9 females, and 36% had 10 or more females. In contrast, 6% of films featured 0 to 4 male characters in speaking roles, 16% had 5 to 9 males, and 77% had 10 or more males.
Findings/Demographic Characteristics
- Female characters remained younger than their male counterparts. The majority of female characters were in their 20s (22%) and 30s (31%). The majority of male characters were in their 30s (32%) and 40s (26%).
- Males 40 and over accounted for 47% of all male characters. Females 40 and over comprised 30% of all female characters.
- 17% of females were under 20, 22% were in their 20s, 31% were in their 30s, 16% were in their 40s, 8% were in their 50s, and 6% were in their 60s or older.
- 10% of males were under 20, 11% were in their 20s, 32% were in their 30s, 26% were in their 40s, 12% were in their 50s, and 9% were in their 60s or older.
- Major female characters are younger than major male characters. 21% of major female characters were under 20, 22% were in their 20s, 27% were in their 30s, 14% were in their 40s, 8% were in their 50s, and 9% were in their 60s. In both samples, female characters experience a precipitous drop from their 30s to their 40s, and few women age into their 60s.
- Major male characters experience a drop from their 40s into their 50s. 12% of major male characters were 19 and under, 12% were in their 20s, 26% were in their 30s, 25% were in their 40s, 14% were in their 50s, and 12% were in their 60s.
- 68% of all female characters with speaking roles were White, 20% were Black, 5% were Latina, 7% were Asian, and 1% were of some other race or ethnicity. 71% of all male characters were White, 15% were Black, 5% were Latino, 6% were Asian, and 3% were of some other race or ethnicity.
- 68% of all female characters were White in 2019. 20% of all female characters were Black. 5% of all female characters were Latina in 2019. 7% of all female characters were Asian in 2019.
- 70% of major female characters were white, 18% were Black, 6% were Latina, and 5% were Asian.
- 46% of female characters but 34% of male characters had a known marital status.
- 73% of male characters but 61% of female characters had an identifiable job or occupation.
- A larger proportion of male than female characters were seen in their work setting, actually working (59% vs. 43%).
Findings/Roles and Leadership
- Male characters were more likely than females to be seen in primarily work-related roles (60% vs. 40%). Female characters were more likely than males to be seen in primarily personal life-related roles (52% vs. 34%).
- Overall, 5% of characters were leaders.
- Females comprised 26% of leaders, while males accounted for 74% of leaders. Females were more likely than men to be portrayed as leaders in two groups, as professionals (ex., doctor or lawyer) and as social leaders (ex., leaders in a neighborhood). Females were least likely to be portrayed as political leaders or leaders of criminal groups.
- Females were most likely to be leaders in professional jobs (67% vs. males 33%), followed by social leaders (63% vs. males 37%), white collar leaders (33% vs. males 67%), religious/spiritual leaders (25% vs. males 75%), blue collar leaders (13% vs. males 87%), political leaders (11% vs. male 89%), and criminal leaders (8% vs. males 92%).
Findings/Behind-the-Scenes Employment and On-Screen Representation
- In films with at least one woman director and/or writer, females comprised 58% of protagonists. In films with exclusively male directors and/or writers, females accounted for 30% of protagonists.
- In films with at least one woman director and/or writer, females comprised 42% of major characters. In films with exclusively male directors and/or writers, females accounted for 35% of major characters.
- In films with at least one woman director and/or writer, females comprised 39% of all speaking characters. In films with exclusively male directors and/or writers, females accounted for 32% of all speaking characters.