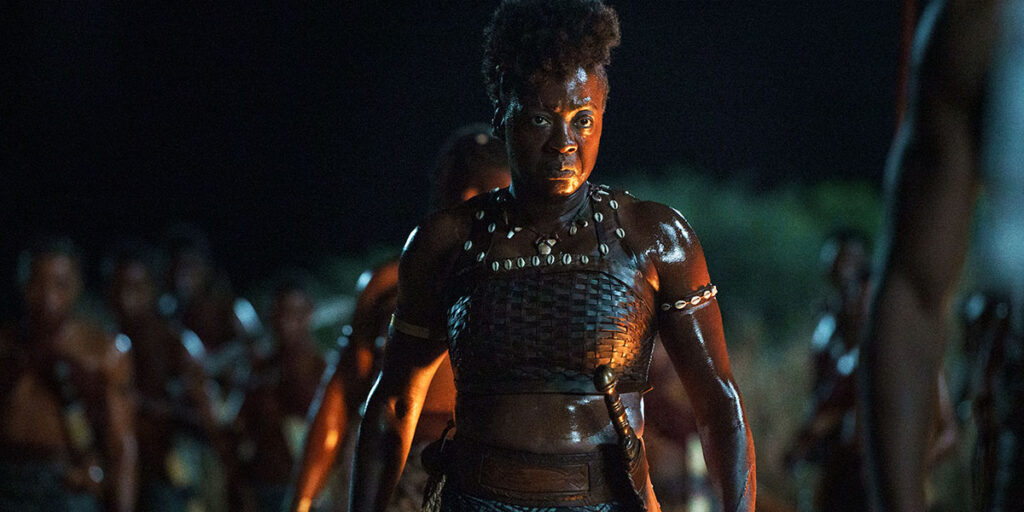
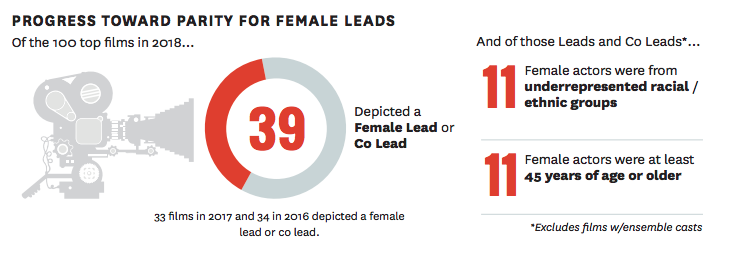
As we’re all well aware, women are very much underrepresented on the big screen. However, according to new research from Dr. Stacy L. Smith and the USC Annenberg Inclusion Initiative, there is some hope on the horizon. “Inequality in 1,200 Popular Films: Examining Portrayals of Gender, Race/Ethnicity, LGBTQ & Disability from 2007 to 2018” found that the number of female leads and co-leads in top-grossing films has been rising in recent years. In 2017, 33 of the top 100 films were led or co-led by a woman; last year, that number increased to 39. Eleven of 2018’s top 100 movies starred or co-starred a woman of color, nearly tripling 2017’s four. In 2018, women aged 45 or older led 11 top movies, as compared to the previous year’s five.
Credit: USC Annenberg
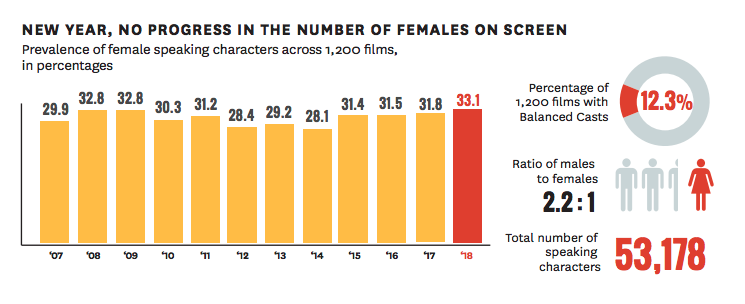
Overall, the time frame considered still featured a pronounced gender disparity on-screen. Female characters accounted for 30.9 percent of all speaking roles from 2007-2018. Last year, 33.1 percent of all roles across the 100 most popular films were held by females, an insignificant increase from 2017’s 31.8 percent.
Credit: USC Annenberg
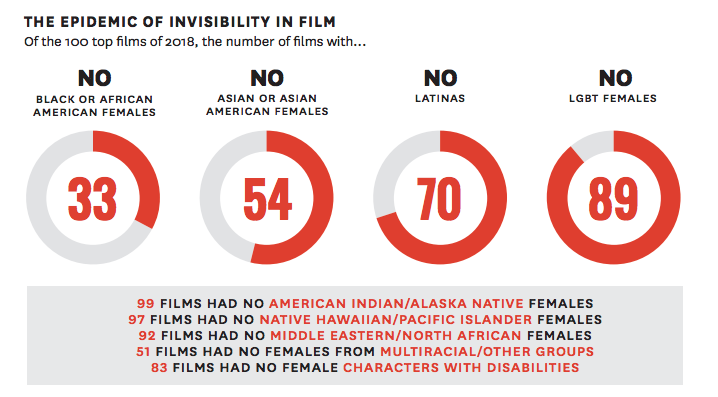
Smith and her co-writers also conducted an “invisibility analysis” “to determine how many movies are missing female characters from different groups,” a press release notes. As previously reported, Latina characters were absent from 70 of last year’s top 100 films. Thirty-three pics were missing Black female characters, 54 were missing Asian female characters, and 51 were missing “girls or women from multiracial backgrounds.” American Indian/Alaskan Native female characters were excluded from 99 films, Native Hawaiian/Pacific Islander females from 97, and Middle Eastern/North African females from 92. Eighty-three top movies had no female characters with a disability, and 89 featured zero female LGBTQ characters.
Credit: USC Annenberg
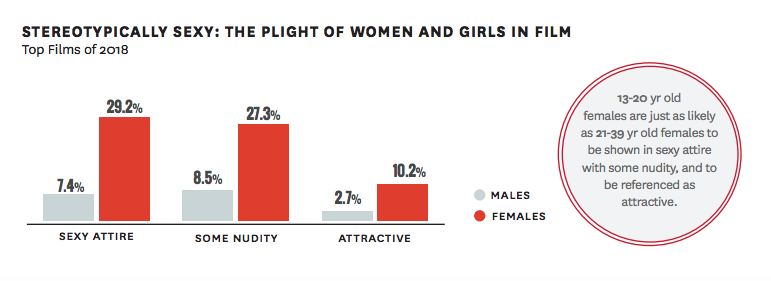
When girls and women were included on-screen, they were twice as likely to be sexualized than their male counterparts — i.e. “to be shown in sexually revealing clothing, partially naked, or referenced as attractive.” In 2018’s top movies, teenage girls (ages 13-20) were just as sexualized as young adult women (ages 21-39).
Credit: USC Annenberg
“These numbers reveal the depth of the erasure of female characters, particularly those from underrepresented racial/ethnic backgrounds, the LGBTQ community, and individuals with disabilities,” said Marc Choueiti, Program Director at the Annenberg Inclusion Initiative. “As we continue to monitor the most popular films released each year, these numbers are one place we will continue to scrutinize for change.”
If there were more women calling the shots behind the camera, perhaps there would be less stereotyping of females on-screen. Unfortunately, the number of female directors is still not budging. Across the 1,335 directors working on the top 1,200 films 2007-2018, only 4.3 percent were women. Asian directors accounted for 3.2 percent of those movies’ helmers. Latinx filmmakers represented just 2.7 percent of the directors on 2018’s top films, and Middle Eastern/North African filmmakers 3.6 percent.
In terms of racial inclusion, the situation is better on-screen. “In terms of all speaking characters, the study observed a 12-year high in the percentage of Black and Asian speaking characters, though the analysis fell short of a 5 percentage point difference from 2007,” per the press release. “One explanation for the increase in Black characters can be found behind the camera, as the number of Black directors rose from six in 2017 to 15 across the 100 top movies of 2018.” People of color accounted for 36.3 percent of the characters in 2018’s top films, a solid increase from 2017’s 29.3 percent.
Popular film is still behind in other areas of inclusion, however. In last year’s top-grossing movies, only 1.6 percent of characters were portrayed with a disability, marking a four-year low. Just 1.3 percent of characters identified as part of the LGBTQ community. The top 500 films from 2014-2018 featured a single trans character.
“In 2018 we saw companies taking steps to ensure that certain groups were included in some of their most notable movies,” said Smith. “While we are pleased to see progress in some areas, efforts cannot end here. There are several arenas where much more growth is needed.” She added, “Despite more than a decade of advocacy, the percentage of female speaking characters has not increased. Additionally, we saw no substantial improvement in the percentage or representation of LGBTQ characters or characters with disabilities. It is crucial not to lose sight of these and other areas that still need to improve,” Smith stressed.
Key findings from “Inequality in 1,200 Popular Films” can be found below. The full study is available here.
Gender
On Screen
- Only 33.1% of all speaking or named characters in the 100 top-grossing films of 2018 were girls/women.
- Only 9% of the movies in 2018 had gender-balanced casts.
- The number of female leads/co leads was significantly higher in 2018 (39 movies) than in 2017
(33 movies) and almost double the number of films in 2007 (20 movies). - Eleven movies featured a girl or woman of color in the leading or co leading role. Overall, 27% of the 100 top films featured a person of color driving the plot.
- Eleven of the 100 top movies of 2018 featured a female 45 years of age or older at the time of
theatrical release in a leading or co leading role. Out of the 100 top films of 2018, only 4 featured a woman of color 45 years of age or older in a lead or co lead role. - Women 40 years of age and above received only 25% of all speaking or named roles in 2018.
- Females were far more likely than their male counterparts in 2018 to be shown in sexually revealing attire (29.2% vs. 7.4%) and with some nudity (27.3% vs. 8.5%). Girls/women were also more likely than boys/men to be referenced as attractive by other characters (10.2% vs. 2.7%).
- Teenage females were just as likely to be sexualized and referenced as attractive by other characters as females 21-39 years of age. Middle aged women were the least likely to be shown in a sexualized light, however.
Behind the Camera
- A total of 1,566 content creators (e.g., directors, writers, producers) were employed behind the camera across the 100 top movies of 2018. Over three quarters (81.5%) of these above the line jobs were filled with males and 18.5% were filled with females. This translates into a gender ratio of 4.4 males to every 1 female.
- Focusing on directors, 112 were hired across the 100 top films of 2018. A full 107 of these directing jobs were filled by males and 5 by females. Only 14.4% of writers and 21.1% of producers were women.
- Over time, there has not been any change in the hiring of female directors across the 100 top fictional films. A total of 4.3% of all directors were women (58 out of 1,335). Given that some female directors work more than once, the total number of individual women hired across the 1,200 movies is 47. The total number of unique men is 657.
- For films with male direction only, the percentage of female speaking characters on screen was 32.5%. When a female was attached to direct, that number jumped to 47.6% of all speaking characters.
- In 2018, 3 female composers were attached to the 100 top fictional films. Across the 12-year sample, only 1.4% (19 out of 1,327) of all composers were women. This translates into a gender ratio of 68.8 males to every 1 female.
Race/Ethnicity
On Screen
- A total of 3,895 speaking or named characters across the 100 top films of 2018 had an ascertainable race/ethnicity. Of those, a full 63.7% were white, 16.9% Black, 5.3% Latino, 8.2% Asian, 1.5% Middle Eastern/North African (i.e., MENA), <1% American Indian/Alaska Native, <1% Native Hawaiian/Pacific Islander, and 4% multiracial/other. In total, 36.3% of speaking characters were from underrepresented racial/ethnic groups.
- The percentage of white characters has decreased significantly in 2018 (63.7%) in comparison to 2017 (70.7%) and 2007 (77.6%). Black characters were at a 12-year high in 2018. A 3.9 percentage point difference was observed from 2007 to 2018 in the percentage of Black characters.
- For Asian speaking characters, 2018 (8.2%) was higher than 2007 (3.4%). 2018 (8.2%) was slightly higher than 2017 (4.8%).
- Films were less likely to erase Black and Asian characters from 2015 to 2018. The erasure of Latinos has increased from 40 films in 2015 to 47 films in 2018. The number of 2018 films
erasing the remaining racial/ethnic groups was as follows: American Indian/Alaska Natives (99
movies), Native Hawaiian/Pacific Islanders (93 movies), MENA (78 movies), and multiracial/other
(31 movies). - Across the 100 top films of 2018, 33 films were missing Black/African American female characters, 54 were missing Asian or Asian American female characters, 70 Latina characters, and 51 girls or women from multiracial/other backgrounds. Female characters from the following racial/ethnic groups were also excluded, including American Indian/Alaska Native female characters (99 movies), female Native Hawaiian/Pacific Islanders (97 movies), and MENA girls and women (92 movies).
- The percentage of underrepresented characters was at a 12-year high in action/adventure movies (40.3% of all speaking characters).
- Out of 100 movies of 2018, a full 27 featured an underrepresented lead or co lead. Fifteen of these films featured Black actors (10 males, 5 females) as leads/co leads and 4 movies depicted Latinos (2 males, 2 females). Two leads/co leads were Asian (1 male, 1 female), one was MENA (male) and 6 were multiracial (3 males, 3 females).
- In 2018, Latinas were the most likely to be hypersexualized – as measured by sexy attire or some nudity — in comparison to females in 4 other groups (white, Black, Asian, other). Females from other racial/ethnic backgrounds were the most likely to be referenced as attractive, particularly in comparison to females that were Black, Asian, or Latina.
Behind the Camera
- Fifteen directors (13.4%) in 2018 were Black, with 14 males and 1 female. Over the 12 year sample, only 79 (5.9%) of 1,335 top jobs were held by Black directors.
- Movies with Black directors filled 44.5% of all on screen speaking or named roles with Black actors. When non-Black directors were attached, the percentage of Black characters on screen drops to 11.3%.
- Black directors filled 15.7% of all speaking roles in their films with Black girls/women. Only 3.6%
of speaking or named characters were Black girls and women in films with non-Black directors. - Of the 112 directors of 2018, only 4 were Asian. This is only 3.6% of the entire sample of
directors working across the 100 top fictional films. None of the 2018 directors were Asian
women. Only 3 jobs have been allotted to Asian female directors over the 12 years evaluated. - Only 3 directors were Latino and 4 MENA across the 100 top films of 2018.
Lesbian, Gay, Bisexual & Transgender Characters
- In 2018, a total of 4,387 characters were assessed for apparent sexuality. Fifty-eight characters
or 1.3% of speaking/named roles were filled with LGB portrayals. Seventeen were lesbian, 33
were gay, and 8 were bisexual (males=4, females=4). Not one transgender speaking character
was depicted on screen across the 100 top movies of 2018. - Over time, the number of LGB characters on screen has changed but not the percentage. In
2018, a full 58 LGB characters were shown on screen which was substantially higher than in 2017
(31 LGB characters) or 2014 (21 LGB characters). The gains were for lesbian and gay characters
but not bisexual characters. - Focusing on leading characters, 2 of the 100 top-grossing films of 2018 featured a protagonist
from the LGBTQ community. - In 2018, 76 movies were devoid of LGB characters whereas 81 movies in 2017 and 86 movies in 2014 did. Eighty-nine movies were devoid of even one female LGBT character.
- In terms of transgender characters, only 1 depiction has occurred across the 500 top-grossing films from 2014-2018.
- Only 36.2% of LGB characters were female and 63.8% were male in the top films of 2018. Nearly
two-thirds were white, 19% Black, 5.2% Latino, 10.3% Asian, and 1.7% multiracial. - Only 6 LGB characters across the 100 top films of 2018 were shown as parents (4 males, 2 female). Only one was from an underrepresented racial/ethnic group. Only 13 LGB characters were depicted in a romantic relationship, with 9 female and 4 male. Ten of these characters were white, 2 Black and 1 Asian.
Characters with Disabilities
- Across the 4,445 characters in the analysis, 1.6% were shown with a disability.
- Over half of the films (58) evaluated in 2018 were missing a character with a disability — a four-year high. A total of 83 films were missing female characters with disabilities. No films featured proportional representation of characters with disabilities when compared to the U.S. population.
- Nearly three-quarters of characters with disabilities were male (72.5%) and 27.5% were female.
Most characters with disabilities were white (63.1%), while 36.9% were from underrepresented
racial/ethnic groups. Just 2 characters with disabilities were LGB. - Examining leading characters, a total of 9 films had a lead or co lead character with a disability. These individuals experienced depression, dyslexia, disfigurement, blindness, heart conditions, HIV/AIDS, or missing limbs.
- Over half of characters experienced a disability in the physical domain (55.1%), 30.4% of characters had a disability in the cognitive domain, and 27.5% of characters were shown with a communicative
disability.